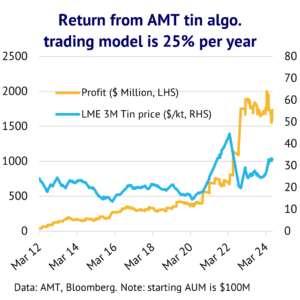
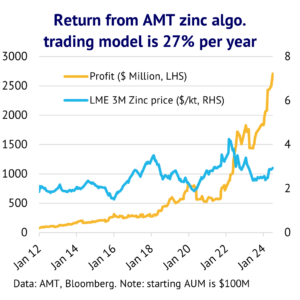
24 July 2024: Base metal prices are driven by a combination of fundamental and technical drivers. One important part of technical analysis is to understand and predict market momentum. In this piece we set out our method for back testing and modelling momentum, looking at all the popular models used in financial markets, including MACD, Bollinger Bands, stochastics and a variety of moving average crossover signals. We have constructed algorithmic trading models that work well historically for all the base metals, based on a swing trading model. For aluminium, copper, lead and zinc, mean reversion models work best, using a variety of different oscillators and methods. By contrast, for nickel and tin, trend following models work best, which look to chase the breakout between a price and a moving average. For tin and zinc, our models have a Sharpe ratio above 1.5, which points to a good risk:reward ratio. We are now using these trading signals to enhance our views on the short-term outlook for base metal prices.
Most base metals rally in the first part of this year, helped by an upswing in global demand. The first part of this year saw most of the LME base metals rallying, with three-month copper and tin leading the way higher, with increases of 11% and 27%, respectively (data to 18 July). The rallies in lead and zinc were modest though, at around 5-6%, while aluminium and nickel moved broadly sideways. Speculators were encouraged to buy industrial metals because the global economic cycle was turning up and OECD interest rates were being cut. Demand in most of the world looked decent and the global manufacturing PMI reached 51 in May, before easing back to 50.9 in June.
However, in mid-July the base metals retreated. The threat of higher inflation seems to be turning up, with input cost inflation accelerating to a 16-month high in June and output prices also picking up (according to the July JP Morgan PMI report). For now, there is something of a disconnect between US Treasury markets – with inflation protected bonds (TIPS) unresponsive – and gold prices, which spiked to fresh record highs in mid-July. While inflation concerns have helped to lift commodities this year, the industrial metals are still fearful about demand weakness in China and for the next few months this looks likely to be a significant headwind for sentiment and prices.
Amid this mixed story for base metals, we have built some algorithmic trading models to gauge whether the upward momentum in prices has now gone into reverse and to assess whether speculative selling is likely to extend. We believe that technical analysis is better at guiding where markets will go in the short-term (i.e. 1-3 months ahead), whereas fundamental analysis is a better guide to the medium-term direction of prices (i.e. from 3-12 months). Certainly, both are important and inter-related. Our models use momentum modelling to create trading signals and they employ a swing trading strategy i.e. the model is either long or short, and never neutral. Also, for simplicity we have not included trading costs or allowed for market slippage. Our best performing models are for tin and zinc and are shown below.
Technical analysis can be split into two components. First, charting i.e. the drawing of trendlines of support and resistance and associated patterns, including triangles, trend channels, reversals and so on. The problem with this approach is that it is difficult to back test these strategies. Besides different analysts may identify various levels of support and resistance, giving unreliable results. Hence, charting is commonly seen as more of an art, than a science.
The second part of technical analysis is momentum modelling. Often, this involves looking at how a price compares to a moving average or a derivative of a moving average. Common momentum indicators include a relative strength index (RSI) and moving average convergence divergence (MACD). The advantage of momentum modelling is that it is more scientific and back testing allows the “best” model to be found from historical patterns. It is important to realise though that a model that performs well in the past will not necessarily perform well in the future. It depends on the extent to which historical patterns repeat in the future, which is inherently unforecastable.
However, there are good reasons to use momentum modelling as a tool because many algorithmic funds, CTAs and hedge funds will take a similar approach to creating technical trading signals. This approach can then become a self-fulfilling prophecy i.e. if key players in the market all use a similar model, then this will translate into buying and selling in the market in the future. This will reinforce the original model identified via back testing.
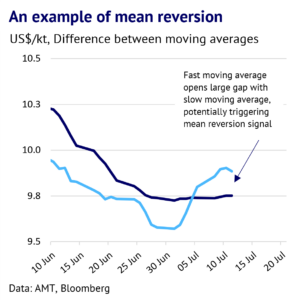
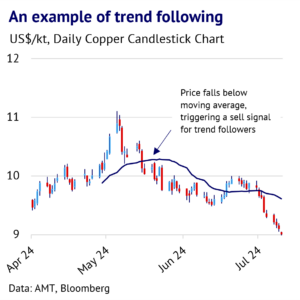
Momentum modelling can be further sub-divided into two approaches. First, mean reversion i.e. the selling of a market that looks overbought and buying of a market that looks oversold. RSI and MACD are both examples of mean reverting models. We show an example of mean reversion above. Second, trend following i.e. the buying of a market that is breaking higher, hoping that the rally will extend and visa-versa. If we assume a swing trading model, this would involve looking for a price to cross from below to above a moving average, which would trigger a buy signal. The price falling from above to below a moving average would trigger a sell signal. We also show an example of trend following above. In a way, mean reversion and trend following are opposite strategies, although this is a slight oversimplification.
It is important to emphasize that these models have no knowledge or intelligence about how fundamentals are changing, but avid technical analysts will tell you that everything you need to know is “in the price”. What this means in practice is that traders who are tracking fundamentals might start to drive up prices, as they see a shortage on the horizon. This would then feedback into a BUY signal being triggered in a trend following model, as the rest of the market senses that something is changing. Potentially, this again supports the idea that momentum modelling should be a useful tool, although clearly it is ideal to track both fundamentals and technical factors to pick up early changes in market direction.
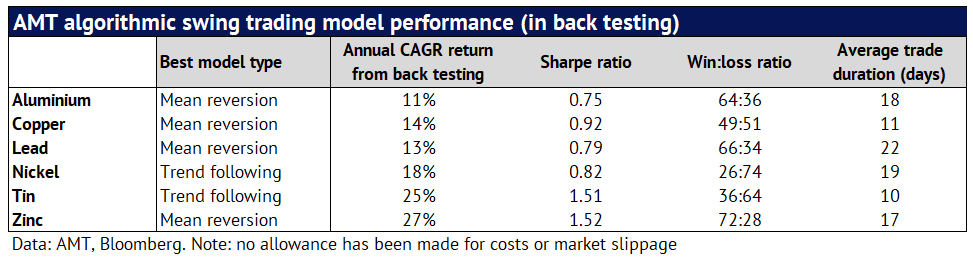
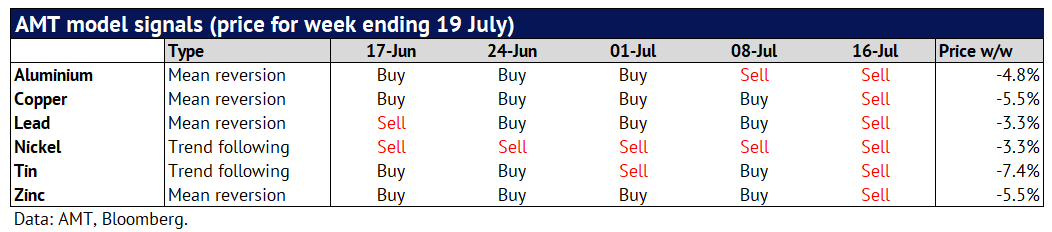
We back tested twenty-three of the most common types of momentum models used in financial markets, to see which ones work best for the six LME base metals. These included DMI, Bollinger Bands, stochastics, RSI, MACD, moving average crossovers (including simple, exponential, variable), Ichimoku, Parabolic and a few other models. We then identified the best performing model over the past 13 years and optimised settings for each model. The signals from the models are shown below. Interestingly, all the models were giving a bearish signal before the most recent drop in prices (on 16 July), which gives us some extra confidence about their effectiveness in the real world.
We find that for aluminium, copper, lead and zinc mean reversion works best, with a variety of different oscillators. This implies that there is a tendency for these markets to move sideways for significant periods of time, which means that the profit from buying the dips and selling the rallies, more than offsets the losses when these markets start trending strongly.
By contrast, for nickel and tin, trend following models work best i.e. there is a tendency for these markets to remain detached for extended periods of time from their trailing moving averages, with limited sharp pullbacks. It is also worth noting at this point that these types of models produce lots of small losses, but profits on winning trades tend to be large, which is the secret to their superior performance. For tin, for example, the win:loss ratio for our trend-following model was 36:64.
For nickel, we are cautious with our conclusion that trend following should work best going forward. The model is not able to easily remove the disorderly trading that took place in 2022 (with the market being briefly suspended), and so it is more likely to produce an unreliable result. We accept an obvious flaw with our model in this case, which needs to be borne in mind.
Overall, we find that the performance of models for nickel, tin and zinc are superior to those for the other base metals. However, the historical testing produces a good result in all cases and high Sharpe ratios. We are now running all these models in real time (i.e. with out of sample data) to see how well they operate going forward and will keep clients updated with their progress. In conclusion, we expect our algorithmic trading signals to enhance our short-term market view. History is likely to repeat itself, but never exactly.