9 January 2025: Donald Trump will start his second term as US President on 20 January and his approach is likely to be radically different to his predecessors, including attempts to raise trade barriers and “Make America Great Again”. While there is some understandable concern about the impact of higher tariffs and a more challenging political environment, his first term as President (before the Covid crisis) was characterised by a period of rising equity prices, a steady US$ and inflation and a (surprising) increase in the US trade deficit. In several key ways, financial markets outperformed compared to his predecessor, Obama. Base metal prices were also higher on average, helped by a weaker US$ and rising equity prices. This looks bullish for his second term, as protectionist rhetoric clashes with the reality of running the country and dealing with global economic drivers.
Trump to return to White House. On January 20, Donald Trump will make an unexpected return to the White House for his second term as US President. During his long election campaign, he promised to “Make America Great Again”. This time around he is also working with a House and Senate controlled by Republicans, which potentially makes it easier for him to drive through his America First agenda.
US President has limited power to drive markets. Like any politician though, there is likely to be a big difference between his rhetoric and what he can achieve, given the current economic/political backdrop. While being US President is certainly a powerful position, all OECD politicians have limited ability to drive financial market performance in their own countries. Central banks are generally responsible for targeting inflation, setting interest rates and controlling monetary policy.
Global factors are often powerful drivers. Furthermore, global events are often key drivers of markets, with the Covid-crisis of 2020 and Russia’s invasion of Ukraine in 2022 being two obvious examples, which led to a spike in inflation and higher government debt levels. Also, war continues in the Middle East/Ukraine/Russia and it is an increasing difficult environment for exports, as a trade war potentially looms between China and the US, due to higher tariffs and increased protectionism across the world.
We look at how markets performed in the first three years of Trump. Despite these reservations, it is still worth examining how key financial markets performed during the first Trump Presidency and we speculate on how financial markets and the base metal markets might perform under the new President, given Trump’s previous track record. To give a fair comparison, we only look at the first three years of his term i.e. from January 2017 to January 2020. We exclude the final year because this was dramatically distorted by the Covid outbreak. In our analysis we compared this three-year Trump period to the final three years of the Obama Presidency i.e. from January 2014 to January 2017.


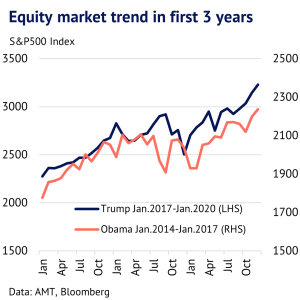
Stock market rose more under Trump than Obama. We have analysed four measures of success, the first three of which are important drivers of base metal prices. First, the US stock market. We show this in our first chart. Using this, both Presidents performed well, although the Trump period saw a 42% increase in the S&P500 equity index, compared to a 26% increase under Obama.
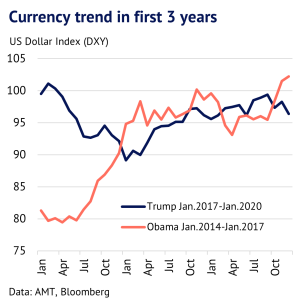
US$ became slightly weaker. A second measure is the US dollar, as indicated by DXY, the trade-weighted measure of the currency. We show DXY in our second chart. It weakened by a modest 3% during the Trump period, whereas it rose by 26% under Obama. A stronger currency suggests confidence in US financial markets and relative outperformance by the economy.
US inflation was stable and close to central bank target. A third measure is CPI inflation, which we show this in our third chart. While the first Trump Presidency ushered in a period of higher tariffs (which should in theory drive up prices), the impact on inflation was clearly muted and averaged 2.1% over the 36-month period. This was almost exactly inline with the central bank’s mandate of 2%. By contrast, Obama saw a period of abnormally low inflation (averaging 1%), with a brief move into deflation in year two of his term.
US trade deficit surprisingly increased. Our fourth measure is the US trade deficit in goods and services. Surprisingly, this was larger under Trump than Obama, who had average deficits of US$46bn and US$40bn, respectively. One of Trump’s aims was to boost exports and limit imports, which should have reduced the deficit, but he failed in this regard. One reason for the failure included strong domestic demand, which encouraged imports. Also, China imposed its own tariffs on the US, which limited US exports. Overall, this shows the limited ability of Trump to offset global forces and the economic reality of a reliance on Chinese manufacturing, which dominates large parts of the supply chain.
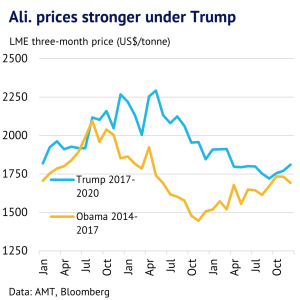
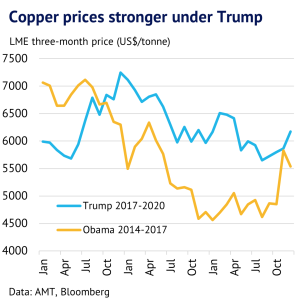
Base metal prices were higher on average. Finally, we look at how the base metal markets performed under both Trump and Obama, given the economic drivers discussed above. It is worth repeating that many factors are at work when it comes to setting prices, including supply side factors and demand in China. However, LME three-month aluminium prices averaged US$1,969/t and US$1,729/t, respectively. Copper prices averaged US$6,255/t and US$5,731/t, respectively. The base metals index (LMEX) averaged 2,988 and 2,681, respectively. Overall, therefore base metal prices were higher under the first Trump administration, compared to Obama.
In summary, the first Trump Presidency was characterised by a steady USD and inflation, rising equity markets and a persistent US trade deficit. We see this backdrop as supportive for base metal markets in the year ahead, as the US President has a limited ability to drive markets on his own. Also, talk about deglobalisation and higher tariffs are unlikely to undermine the current favourable environment for financial markets and base metals, assuming history repeats itself.

