2nd August 2023: Base metal prices have a close relationship with LME net speculative positions. Tracking these speculative flows helps to explain why markets are moving and allows us to differentiate between investment-driven changes in price and fundamental changes and to assess whether there is a gap between the two. There is also a forward-looking component to consider. Investors are assumed to have better insight into the outlook for prices and therefore when they are moving from bearish to bullish (or visa-versa) this often translates into a change in market trend in the weeks that follow, with other market participants attempting to follow the “smart money”.
We explain that the highest correlation (most important driver) for base metal prices comes from looking at the speculative category for Investment Funds and Other Financial Institutions (IFOFI). This is particularly true for copper and zinc. For aluminium and tin this category is also the most significant from a statistical perspective, but the relationship is weaker. It is also important to note that for all the base metals when speculative positions are at extreme levels (either very high or very low) this is a warning sign that investor flows may change direction soon and mean-revert, causing prices to follow.
LME COTR report gives a weekly snapshot of speculative flows. We currently produce a report – the AMT LME Commitment of Traders (COTR) report – which analyses the weekly change in LME net speculative positions. In this research piece we explain why the report is useful and we look at the different speculative categories available and explain why the IFOFI grouping is the best one to use from a statistical perspective.
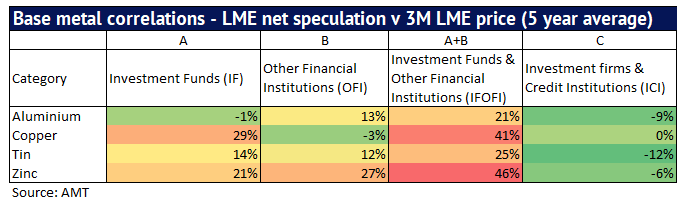
Alternative measures of speculative flows show weak correlations. In the table below we show some alternative measures of speculative flows to see how these correlations compare to IFOFI. First, we separate out IFOFI into its components – Investment Funds (IF) and Other Financial Institutions (OFI), in columns A and B. We also add a third category Investment Firms and Credit Institutions (ICI). For aluminium, we can see that IF and OFI on their own have a lower correlation than the two combined. ICI has a negative correlation and so does not seem to be an important driver of prices. A similar result can be seen across the other base metals – copper, tin and zinc. It is also worth noting that copper and zinc show high levels of correlation between IFOFI speculative flows and price at 41% and 46% respectively. Aluminium and tin show low levels of correlation at 21% and 25% respectively. Overall, this confirms that there is strong statistical evidence that tracking the IFOFI category gives us valuable insight into why prices are moving and is one tool used by traders for predicting future price trends and for helping the industry more generally to manage price risk.
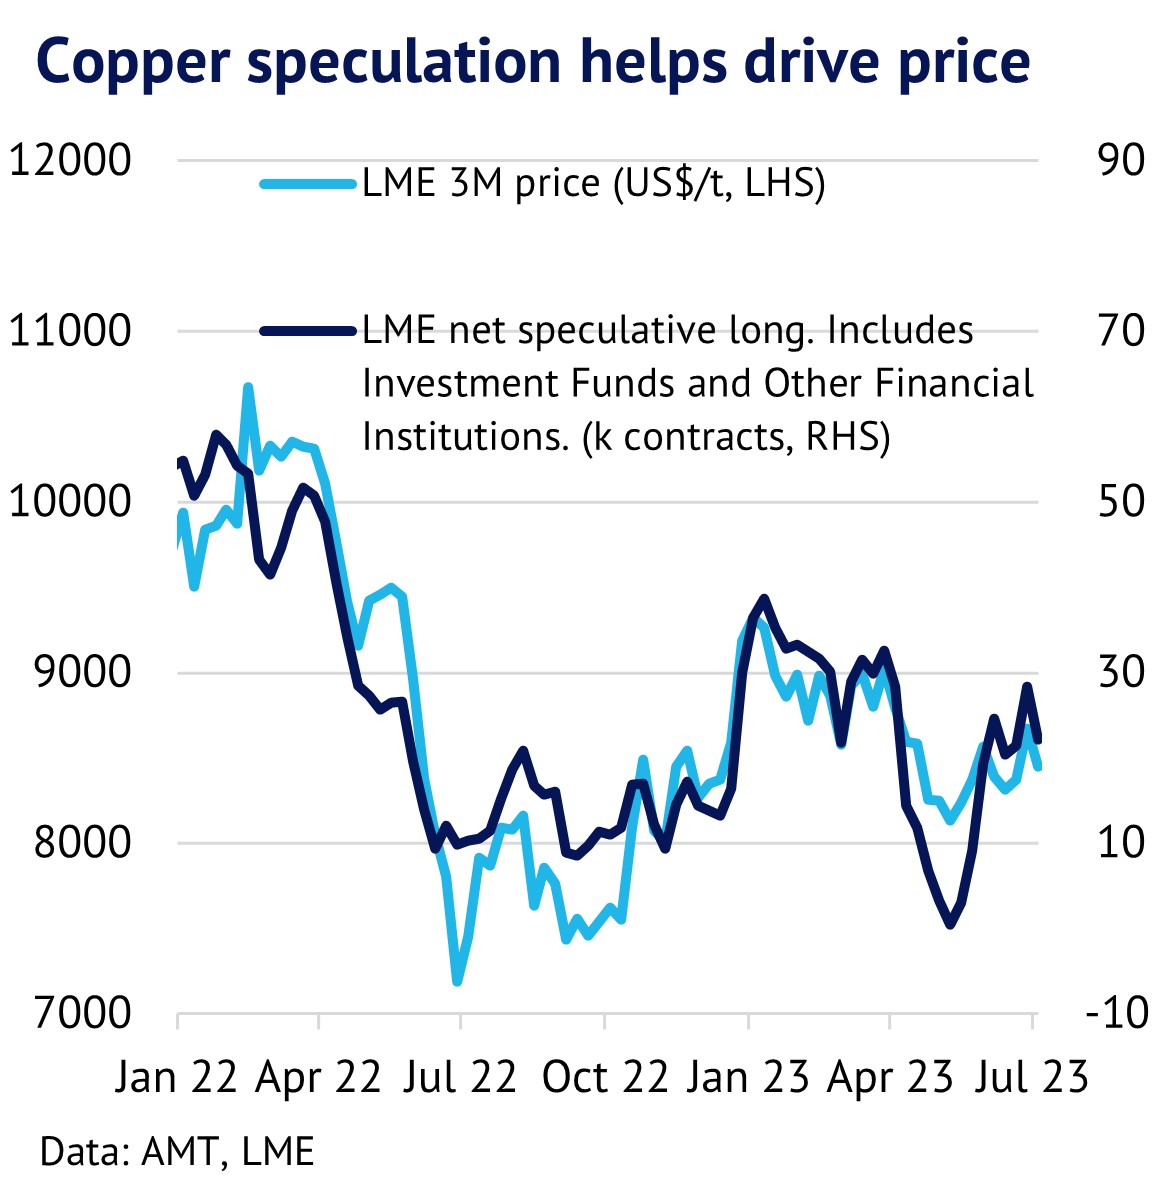
Visually the link between flows and copper prices is also striking. In the charts below we examine the link between LME copper prices and our preferred measure of speculative flows IFOFI. The period from January to mid-July 2022 saw speculators cutting their positions aggressively (see the dark blue line) in response to weak economic activity and this appears to have helped to drag down prices (light blue line). After this, speculative positions have moved broadly sideways and prices have tended to track these flows.
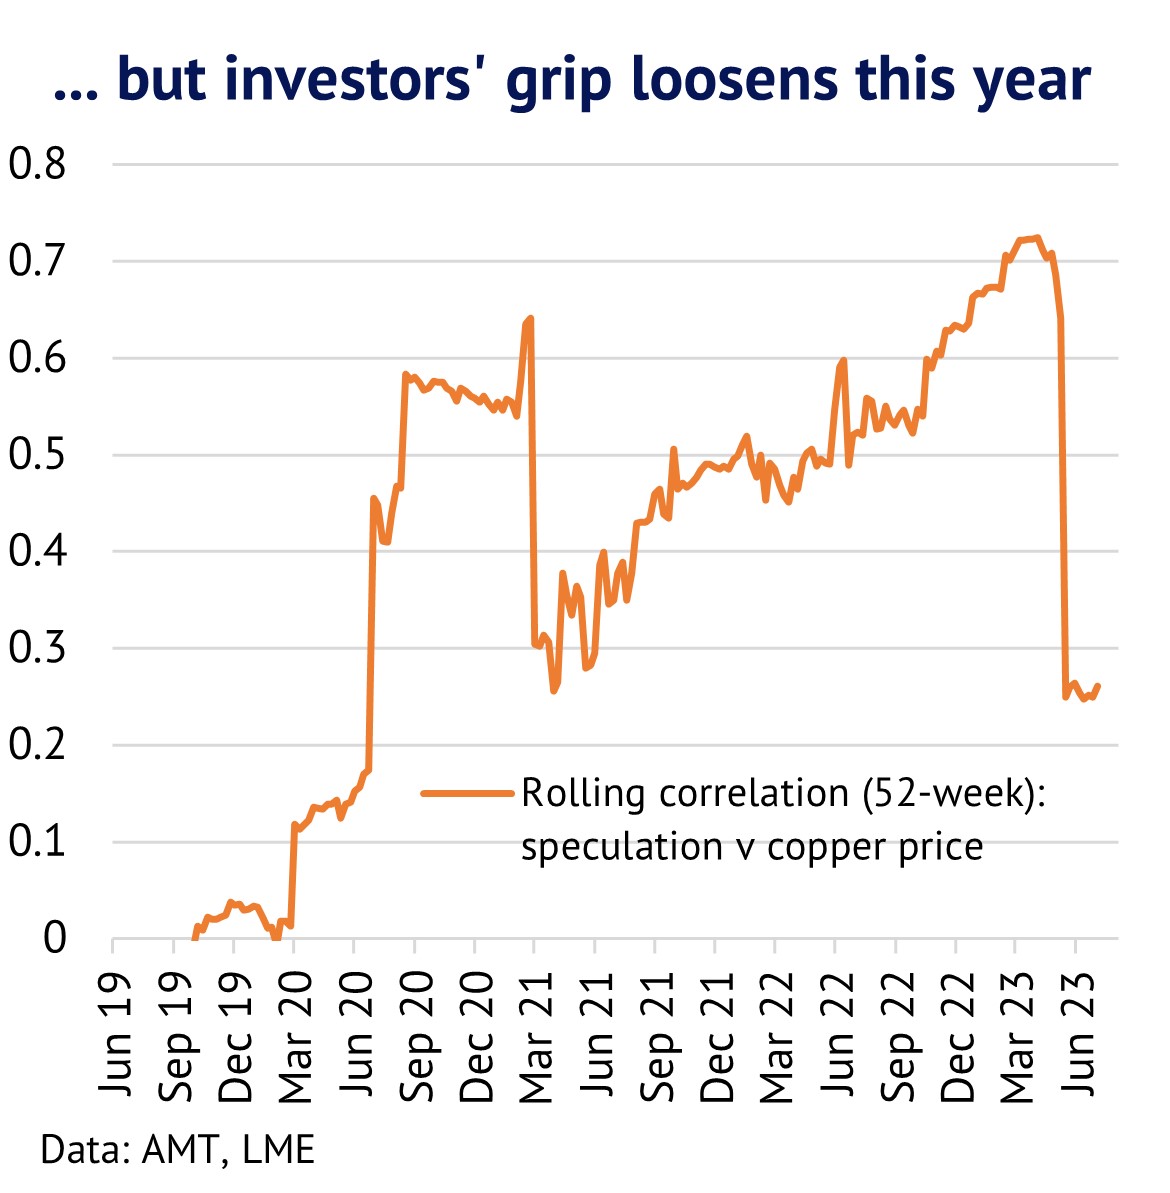
In the second chart on the right, we show in orange the 52-week rolling correlation between speculative IFOFI changes and copper prices to examine in more depth the statistical relationship between the two variables. Back in 2019 the correlation was very low and close to zero, but it trended higher through most of 2022 and into early 2023. The correlation reached 70% in April 2023, showing that speculators seemed to be dominating price action, with fundamentals playing a limited role. Recent months have seen the correlation fall back though, with copper trending sideways and investor reacting to an uncertain market outlook.
Aluminium’s correlation is lower, but prices also track IFOFI speculative flows. We also look at aluminium’s correlation with IFOFI changes in the charts below. We can see with the dark blue line that speculators started to cut positions from early 2022 and prices fell soon after. The smart money in this case moved significantly ahead of prices, which continued to rally into early March. Speculative flows then reached a floor in September 2022. Unlike copper, speculative flows for aluminium have trended lower through most of this year and this appears to have been a factor depressing aluminium prices.
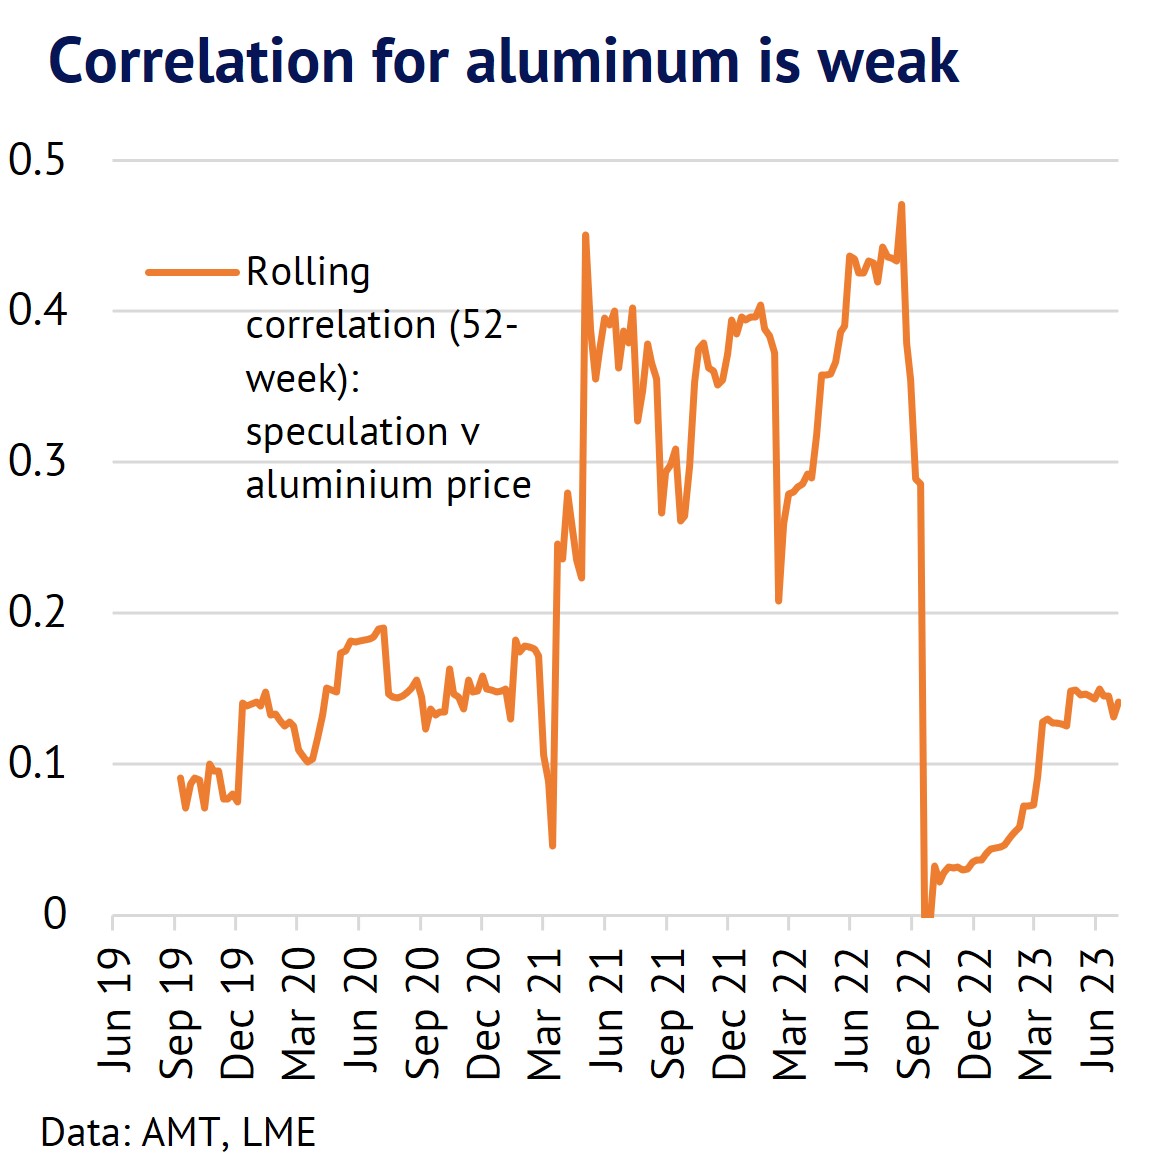
In the orange line we again showing the 52-week rolling correlation between LME 3-month prices and IFOFI. Aluminium mostly shows a lower correlation than copper, indicating that speculative flows are less important in terms of price dynamics. Indeed, in September 2022 the correlation briefly dropped down to around zero. Since then, there has been a modest uptrend to around 15% in mid-July 2023. Overall, our conclusion is that speculators using the IFOFI category play a role in moving aluminium prices, but the link is rather weak and certainly much weaker than for copper.

In summary, IFOFI flows are worth following closely to help understand why base metal prices are moving and to separate out the role of fundamentals and speculation. Across the base metals, correlations vary across the different speculative categories, but IFOFI is a superior measure to follow. Over a 5-year period we believe that speculators have played a more significant role in moving copper and zinc prices than for aluminium and tin, although correlations can change significantly over time and not all speculative activity will be picked up by the LME COTR data. In conclusion, it is worth following the money!