Copper prices have fallen in recent weeks, as financial markets have started to worry about
the impact of rising US interest rates and the ripples emanating from the collapse of Silicon Valley Bank.
Copper arbitrage on COMEX is also trending down in line with lower speculative positions on the LME,
confirming a broad retreat. However, the latest signals on Chinese copper demand look bullish, with utilisation rates ramping up at fabricating plants. Overall, there is likely to be more volatility to come, but we expect copper prices to trend higher in response to tightening fundamentals in China.
Copper prices trend lower, tracking global risk appetite. Three-month copper prices rallied in January above US$9,500/t, but since then bearish sentiment has reasserted itself, resulting in a drop below US$9,000/t by 20th March. One reason for this drop is that financial markets are wobbly and global equity prices have fallen in recent weeks. The US Fed has been steadily raising interest rates in response to high inflation and the collapse of Silicon Valley Bank added to market nervousness about a potential credit crunch and recession. However, copper fundamentals still look supportive, with the Chinese economy bouncing back in the first quarter of this year, helped by ample government stimulus and a recovery after Covid lockdowns.
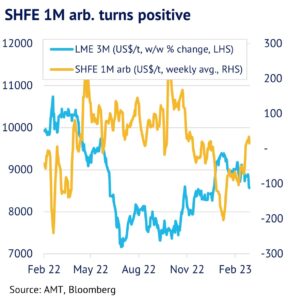
Copper arbitrage window reopens in China. One signal of a brightening picture in China is that the 1-month price on SHFE has moved back above the equivalent LME price. In our first chart, we show a 5-day rolling average of this arbitrage, which reached US$22/t on 15 March. This had been in a significant discount for most of this year, but is now back into positive territory for the first time since 2 January. China exported 42kt of refined copper in February and it was planning to export more. However, the incentive to do this has now disappeared and the country is likely to cut overseas shipments, which should help to underpin LME prices in the weeks ahead.
Demand in China on an upward track, amid inventory draw down. Another signal of improving market conditions in China comes from weekly data on utilisation rates at copper fabricating plants. According to CRU data, utilisation rates at wirerod plants fell to just 50% on 3 February, but then rose to 75% by 17 March. Similarly, rates at tube mills have doubled over the same period. Recent history suggests that there is still more scope for growth from here, if demand conditions are favourable. Moreover, the most recent data on credit conditions shows that there is plenty of stimulus in the pipeline. Data for new yuan loans showed 29% y/y growth in the first two months of this year, which should boost the economy in March and April.
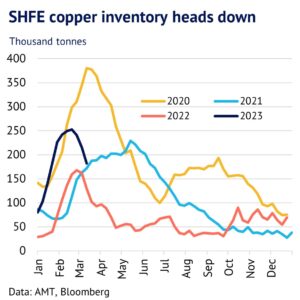
It is also worth noting that copper inventory on SHFE has fallen and the Chinese economy is now entering a period of seasonal strength in late March and April. Inventory rose from 80kt at the start of this year to reach 252kt on 24 February. Since then, there has been a 28% fall to 182kt. As we show in our chart, there is a clear pattern of inventory levels rising during the Lunar holiday and in Q1 and then trending down in the months that follow. This year this data is giving a moderately bullish signal, as inventory levels peaked early in the year and are now coming down from a low level compared to 2020. Overall, the latest signals from China are therefore bullish.
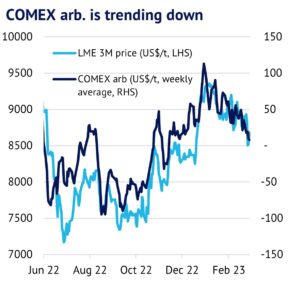
COMEX arbitrage trending down, which is weighing on LME prices. However, more bearish for copper has been the headwinds coming from financial markets more generally, with the S&P500 equity price down 4% m/m (20 March) and the US$ stronger. The US dominates global capital markets and US investors are more likely to trade on COMEX, as it is a domestic exchange, rather than the LME. COMEX copper is therefore favoured over LME copper. Some confirmation of this comes from BCOM Index – one of the largest indices for commodity investors – which has a 5.2% allocation to COMEX copper and a zero allocation to the LME.
We can see in our next chart that in September and October 2022 there was a deep discount on COMEX, which helped to push down LME prices. However, this discount narrowed in the remainder of 2022 and then turned into a premium, which helped to boost LME prices soon afterwards. By contrast, this year has seen the COMEX premium fading once more, which is consistent with a more cautious approach by investors, as they retreat from risk assets more generally.
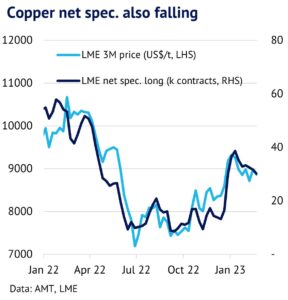
LME net speculation positions help to drive prices and are now being cut. Another broader measure of investor interest in copper comes from the LME COTR report, which we show in our next chart. Net speculative long positions surged from April 2020, as OECD countries started to emerge from Covid lockdowns and copper prices tracked higher in the months that followed, before starting to trend lower once more from February 2021. Once again investors have tended to act ahead of price, making them an important leading indicator. The most recent data has shown that speculators are once again cutting net longs and the trend has been downwards since 27 January 2023. This suggests that downward pressure on copper prices will be maintained in the weeks ahead, offsetting some of the strong fundamentals coming through from China that we have highlighted above. Nevertheless, we believe that the floor for copper prices is not too far away and prices should trend higher in the weeks ahead.